
Rewind: Where are India’s farm exports going
By Dr Jadhav Chakradhar and Dr Arun Kumar Bairwa
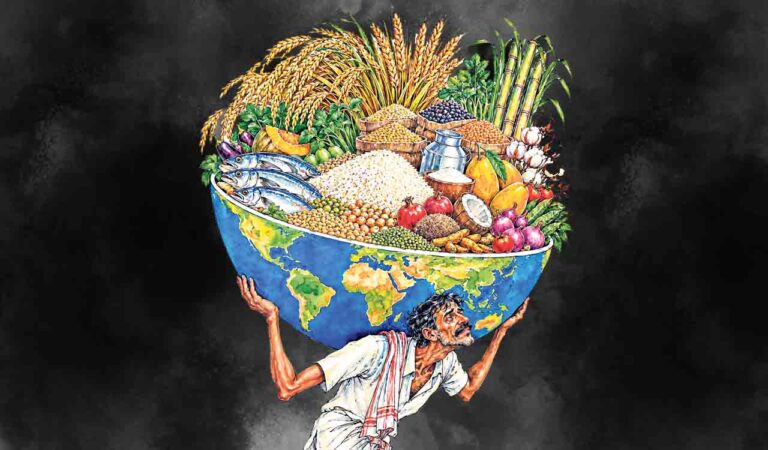
India’s agricultural trade is entering a new phase. The question is no longer how much India exports, but where those exports go, and how exposed those markets are when geopolitics intrudes. The Russia-Ukraine war disrupted global grain markets and led India to restrict wheat exports in 2022. More recently, tariff tensions with the United States have affected Indian seafood, and exporters have responded by looking elsewhere.
Using trade data for 1997-2025, this article asks whether India is truly diversifying its agricultural markets or simply shifting its dependence from one set of countries to another. The evidence points to a paradox. India is selling to more countries, but growth comes from bulk commodities, while the shift towards higher-value, processed products remains slower.
Slower Growth
India’s rose from $6.6 billion in 1997 to $54.0 billion in 2025, an eight-fold increase (Table 1). Imports rose faster, from $2.1 billion to $36.2 billion, a 17-fold increase. The agricultural trade surplus, which peaked at $24.2 billion in 2013, stood at $17.8 billion in 2025.
The pace of growth has weakened sharply. Between 2007 and 2013, exports grew 19.4% per year, and since 2013, they have grown 2.4% per year. Exports fell in nine of the 28 years, including five of the six years between 2014 and 2019. India exports substantially more than it did three decades ago, but the expansion has become slower and considerably less predictable.
Value Shift
Has India moved down the value chain? Not over the long run, and the distinction matters. A closer look at India’s agricultural exports shows that the country has actually moved towards more processed food over time. The share of in agricultural exports rose from 4.3% in 1997 to 15.1% in 2025, roughly tripling.
The raw export data appear to say otherwise: cereals rose from 13.8% to 23% and meat from 3.3% to 9.2%, while fish fell from 18.2% to 12.6% and spices from 17.2% to 10.4%. But a large part of that reshuffling is the collapse of oilcake and animal fodder, from 14.3% to 4.1%. Oilcake is a by-product rather than a processed good.
Alongside the rise in cereals and meat, every processed food category increased its share of agricultural exports: sugars and confectionery from 1.1% to 4.7%, preparations of vegetables and fruit from 0.5% to 2.4%, preparations of meat and fish from almost nothing to 1.9%, preparations from 0.5% to 1.8%, and dairy from 0.5% to 1.8%. Individually small, they have all moved in the same direction. Together, they explain why the share of processed food in India’s agricultural exports has roughly tripled since 1997.
The real concern is recent. The share of processed food exports peaked at 20.1% in 2022 and has since fallen to 15.1%. This decline is not simply because total agricultural exports grew faster and made the processed share look smaller. The value of processed exports itself fell, from $10.3 billion in 2022 to $8.1 billion in 2025, even as total exports climbed to a record level.
Two forces explain the reversal. The first is the export restrictions imposed from May 2022, which pushed the basket towards cereals, a category that is large, politically salient. and subject to intervention. The second trend is more lasting: India’s fastest-growing export markets tend to buy less processed products. Processed food accounts for 18.5% of India’s exports to rich countries compared with only 13.3% to other countries.
As the destination mix shifts away from the rich-country group, the overall share of processed food is dragged down, even while both groups are individually rising. The alone absorbs 16.6% of India’s processed food exports, more than twice the share of any other buyer. In other words, India is diversifying its export markets, but this diversification is happening alongside a lower share of value-added, processed products.
Markets Trends
Of the five largest markets in 1997, three remain in the top five in 2025—the United States, UAE and Saudi Arabia. Japan fell from first to 21st and Russia from third to 14th, while China rose from sixth to third and Vietnam from 36th to fourth. Iraq also recorded a sharp rise, moving from 67th to 8th. India’s exports to Japan increased only marginally from $0.75 billion to $0.77 billion, while exports to Russia rose from $0.45 billion to $1.02 billion. Because India’s total agricultural exports grew 8.2-fold, markets expanding more slowly lost share arithmetically. India has not necessarily lost its established markets in absolute terms; rather, it has added new ones at a much faster pace.
Japan is the one genuine exception, and an instructive one. to Japan fell from $559 million to $405 million. A market built on a single demanding product was never replaced with anything else. The expansions are equally specific, and almost all in bulk commodities. Vietnam grew 74-fold, on buffalo meat ($810 million) and fish ($490 million), much of it moving onward to China. Iraq grew 310-fold, on rice ($772 million) and meat ($317 million). Bangladesh and Nepal grew on rice, oilcake and vegetables.
The UAE, functioning largely as a re-export hub, grew on spices, cereals, meat and tobacco. China’s growth came in fish ($1.3 billion), vegetable oils ($835 million) and spices ($663 million). India now sells to 208 destinations, up from 174 in 1997, and the five largest markets take 32.7% of exports, down from 41.3%.
The markets growing fastest tend to buy staples in bulk. By contrast, markets that buy more processed, certified, and branded food, including the United States, the United Kingdom, Canada and Japan, generally grow more slowly. That single fact drives both trends above. India’s share of agricultural exports to OECD markets fell from 45.7% in 1997 to 28.1% in 2025. India is not simply exporting a different basket of products; it is increasingly selling the same products to different buyers.
Table 2 shows how unevenly that played out. moved furthest: their rich-country share fell from 59% to 35%, with China rising from nothing to 12%. Seafood moved less, from 70% to 56%, which is precisely why American tariff decisions still register in the national total. Meat had almost no rich-country exposure to lose, at 1% in 1997 and effectively none today. Cereals, the largest chapter, did not diversify at all: the Gulf’s share fell from 47% to 36% while Africa’s rose from 23% to 36%— one concentration exchanged for another.
Trade Shocks
The provides a useful illustration. The US share of India’s seafood exports fell from 32.6% in 2024 to 26.8% in 2025. Yet total seafood exports rose over the same period, from $5.9 billion to $6.8 billion, as exporters to other markets, including Europe, Vietnam, and China, increased. This shows one form of trade resilience: the ability to redirect exports when demand in a major destination weakens.
However, companies that already have buyers in other countries, access to finance, and the certifications required for markets such as Europe and Japan were able to shift sales within a year. Smaller or less-prepared exporters may not have such options: a tariff does not redirect trade; it ends it. The ability to find new buyers depends not just on trade policy but also on access to finance, logistics, and the network to reach new markets.
Who Gains?
This is the hardest question, and trade data alone cannot answer it. What they can show is why scepticism is warranted. The products growing fastest — rice to Iraq and West Africa, buffalo meat to Vietnam, oilcake to Bangladesh and Nepal — are bulk commodities. Farmers receive only a small share of the final export prices shaped by procurement policy and trader margins. So higher do not necessarily mean higher farm incomes.
More important is an imbalance in government policy. Export restrictions are imposed when world prices spike. The wheat ban came in May 2022, at the peak, and rice restrictions followed in 2023. This means farmers can lose out when export opportunities weaken, but may not fully benefit when global prices rise and exports become more profitable.
To know whether rising exports have actually increased farmers’ incomes, we need more evidence—especially the prices farmers receive for crops sold for export and the incomes of farmers in districts that depend heavily on exports. Until that evidence is available, the proposition that export growth has raised should be treated as an assumption rather than a finding.
Resilient Policy
Three implications follow. First, India should diversify strategically rather than simply widen the list of destinations. Markets differ in payment reliability, and regulatory stability, and a heavy dependence on a single market for a single product can be more dangerous than an aggregate basket suggests.
Second, policy should recognise that the diversification agenda and the value-addition agenda currently pull in opposite directions and resolve that tension deliberately. Retaining access to standards-demanding markets is what sustains investment in cold chains, certification and processing capacity. Abandoning them for easier bulk markets buys volume at the cost of value.
Third, export policy needs predictability. must remain a priority, but repeated and sudden restrictions undermine both farmer incentives and India’s credibility as a supplier. A transparent framework for when restrictions may be imposed, and for how long, would give producers something to plan against.
India has successfully widened the geography of its agricultural exports. Whether that amounts to resilience depends on what it is selling, to whom, and whether the gains reach the farm. On all three counts, the answer to each one is less reassuring than the headline export figure suggests.
Notes from the Field
- Processed food exports fall: Their share dropped from 20.1% in 2022 to 15.1% in 2025, with the value falling from $10.3 billion to $8.1 billion
- Bulk commodities drive new markets: The fastest-growing destinations largely buy staples such as rice, meat, fish, oilcake and vegetables
- Vietnam and Iraq lead the surge: Exports to Vietnam grew 74-fold, driven by buffalo meat and fish, while exports to Iraq grew 310-fold, led by rice and meat
- More markets, more bulk trade: India now exports to more destinations, reducing overall concentration, but recent growth is increasingly driven by bulk commodities sold to emerging markets rather than premium, processed-food markets
- Export growth does not ensure farmer gains: Trade data cannot establish higher farm incomes. Bulk exports may leave farmers with a limited share of the final export value, while sudden restrictions can limit gains when global prices rise
(Dr Jadhav Chakradhar is Assistant Professor of Economics, Centre for Economic and Social Studies [CESS], Hyderabad. Dr Arun Kumar Bairwa, Assistant Professor of Economics, Indian Institute of Management Amritsar)